Scoring Detectors and Trackers
Summary
This document corresponds to the scoring and evaluation example folder within a VIAME desktop installation. Contained in this folder are a few options for scoring either detections, frame-level classifications, or object tracks.
All scripts call score_results.py with a computed detections file and a ground
truth file, both in VIAME CSV format. Two example files are provided:
detections.csv– computed detections with confidence scoresgroundtruth.csv– ground truth annotations
For each script, there are two operating modes: a normal (“across all”) option and a per-class option. The normal method will score the outputs of all categories jointly together, typically producing a results figure or table showing all object classes. In most of these cases the default is to treat the class with the highest confidence in a detection as its respective label, and ignore any classes with lesser scores. In the per-class usage, this will not be the case, and the confidence score for each category will be considered regardless of other categories, and a plot/chart for a single category will be generated (for each category).
Common options accepted by all scripts:
-iou-thresh (default: 0.5) – IoU threshold for matching detections to ground truth.-threshold (default: 0.0) – Minimum confidence threshold for computed detections.-labels – Optional label synonym file for mapping between class name conventions.--per-class – Generate separate results for each category independently.--ignore-classes – Treat all detections as a single class (classless scoring).PRC and Confusion Matrices
Scripts:
detection_prcs_and_conf_mat_across_all – All categories scored jointly.detection_prcs_and_conf_mat_per_category – Each category scored independently.These scripts produce Precision-Recall Curves (PRC), confusion matrices, and a summary metrics table. Input can be in any format VIAME supports (e.g. VIAME CSV).
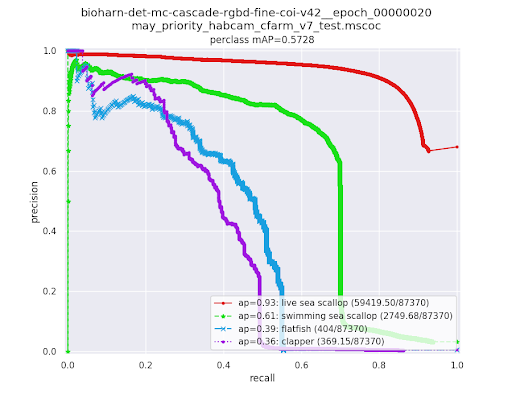
Precision-Recall Curve (PRC): Shows the trade-off between precision and recall as the confidence threshold varies. Each point on the curve represents the precision and recall achieved at a particular confidence threshold. One curve is generated per class. A detector with perfect performance would have a curve that stays at precision=1.0 across all recall values. The area under each curve is the Average Precision (AP) for that class.
Precision = TP / (TP + FP) – Of the detections the model produced, how many were correct.
Recall = TP / (TP + FN) – Of the ground truth objects, how many did the model find.
Average Precision (AP) – Area under the precision-recall curve for a single class, summarizing performance across all confidence thresholds.
Mean AP (mAP) – The mean of AP values across all classes. Reported in the plot title (e.g.
perclass mAP=0.5738).Max F1 – The best F1 score achievable at any threshold, where F1 = 2 * precision * recall / (precision + recall).
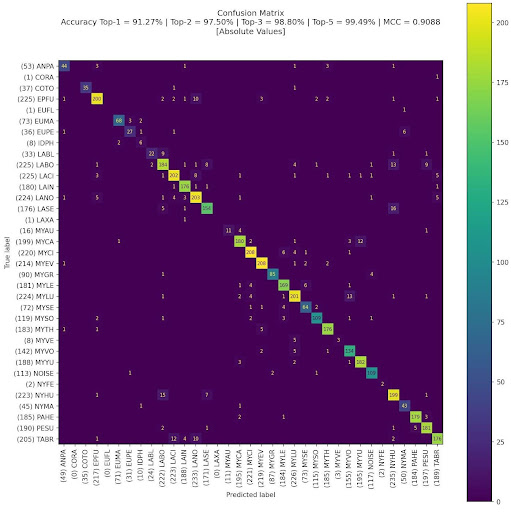
Confusion Matrix: Shows how ground truth categories (rows) are classified by the detector (columns). Values on the diagonal represent correct classifications. Off-diagonal values show misclassifications between categories. The matrix header reports:
Top-1 Accuracy – Fraction of samples where the top predicted class matches the ground truth.
Top-2, Top-3, Top-5 Accuracy – Fraction where the correct class is among the top N predictions.
MCC (Matthews Correlation Coefficient) – A balanced measure of classification quality that accounts for class imbalance, ranging from -1 (total disagreement) to +1 (perfect prediction).
Metrics Table:
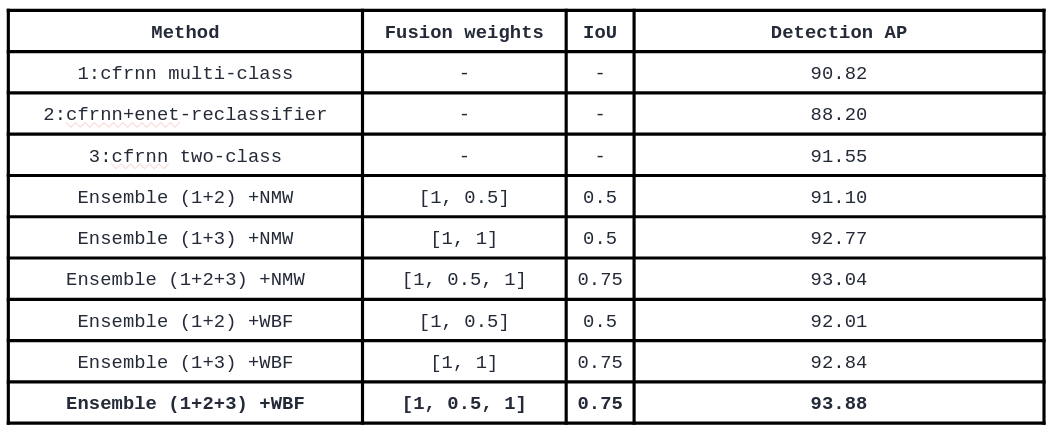
A per-class summary table is also generated (metrics.csv) listing:
Method – The model or ensemble configuration evaluated.
Detection AP – Average Precision for each class or ensemble combination.
When using --per-class, separate output directories are created for each category,
each containing its own PRC plot, confusion matrix, and metrics file.
Output is written to the folder specified by -det-prc-conf.
Receiver Operating Curves (ROC) and Fixed Detection Metrics
Scripts:
detection_rocs_across_all – All categories scored jointly into a single ROC.detection_rocs_per_category – One ROC curve generated per category.These scripts use the KWANT score_events tool to generate Receiver Operating
Characteristic (ROC) curves.
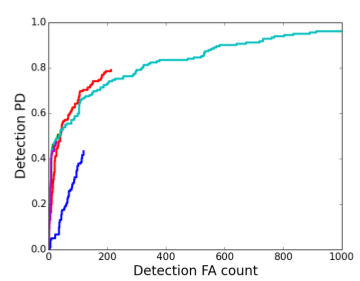
ROC Curve: Plots Detection Probability (Pd) on the Y-axis against False Alarm count (FA) on the X-axis as the confidence threshold is swept from high to low. Each point on the curve corresponds to one threshold value. The curve shows how many true detections are found (Pd) for a given number of false alarms (FA).
Detection Pd (Probability of Detection) = TP / (TP + FN) – The fraction of ground truth objects successfully detected. Also called recall or true positive rate.
Detection FA (False Alarm count) – The total number of false positive detections at a given threshold.
A good detector reaches high Pd with few false alarms (curve rises steeply toward the upper-left corner).
When using --per-class, a separate curve is generated for each category on the
same plot, color-coded in the legend. Without --per-class, a single aggregate
curve is produced.
Additional plot options:
--logx – Use logarithmic scale for the FA axis (useful when FA counts span
several orders of magnitude).--autoscale – Automatically scale axes to fit the data.-rangey min:max – Set Y-axis range (e.g. 0.0:1.0).-rangex min:max – Set X-axis range.Output is written to the PNG file specified by -det-roc.
MOT - MOTA, IDF1, and other High-Level Track Statistics
Scripts:
track_mot_stats_across_all – All categories scored jointly.track_mot_stats_per_category – Each category scored independently, with
optional confidence threshold sweep and DIVE filter file generation.These scripts use the motmetrics Python library to compute standard Multiple
Object Tracking (MOT) benchmark metrics. They evaluate how well computed tracks
match ground truth tracks over time, considering both detection quality and identity
consistency.
Core MOT Metrics:
IDF1 (ID F1 Score) – The primary identity-aware metric. Measures how well computed track IDs are associated with ground truth IDs over the full sequence. Computed as the harmonic mean of ID Precision (IDP) and ID Recall (IDR). Higher is better; 1.0 = perfect identity association.
MOTA (Multiple Object Tracking Accuracy) – Measures overall tracking quality accounting for false negatives, false positives, and identity switches: MOTA = 1 - (FN + FP + ID_switches) / total_GT_detections. Can be negative if errors exceed ground truth count. Higher is better.
MOTP (Multiple Object Tracking Precision) – Average IoU overlap between matched computed and ground truth detections. Measures localization quality independent of detection/association quality. Higher is better; 1.0 = perfect bounding box overlap.
Identity Metrics:
IDP (ID Precision) – Fraction of computed detections correctly assigned to their matched ground truth identity.
IDR (ID Recall) – Fraction of ground truth detections correctly covered by their matched computed identity.
Detection Counts:
Recall – TP / (TP + FN), fraction of ground truth detections matched.
Precision – TP / (TP + FP), fraction of computed detections that are correct.
num_false_positives – Total count of computed detections with no matching ground truth.
num_misses – Total count of ground truth detections with no matching computed detection (false negatives).
Track Quality Categories:
mostly_tracked – Ground truth tracks where >= 80% of their lifespan is covered by a computed track.
partially_tracked – Ground truth tracks covered 20-80% of their lifespan.
mostly_lost – Ground truth tracks covered < 20% of their lifespan.
num_unique_objects – Total number of ground truth track IDs.
Track Consistency Metrics:
num_switches – Number of identity switch events, where a computed track changes which ground truth object it is following.
num_fragmentations – Number of times a ground truth track’s coverage is interrupted (tracking gaps).
num_transfer – Number of times a computed track transfers to a different ground truth object.
num_ascend – Number of times a computed track takes over tracking from another computed track.
num_migrate – Number of times a ground truth object is handed off between different computed tracks.
Threshold Sweeping and DIVE Filter Generation:
When the per-category script is run, it uses --sweep-thresholds to test many
confidence thresholds and find the optimal value for each class. The script reports
the threshold that maximizes IDF1 and the threshold that maximizes MOTA for each
class. With -filter-estimator avg_minus_1p, it also generates a
dive.config.json file containing per-class confidence thresholds that can be
loaded directly into the DIVE interface to filter detections at optimal levels.
Output is written to the text file or folder specified by -trk-mot-stats.
KWANT - Basic Track and Detection-Level Properties
Scripts:
track_kwant_stats_across_all – All categories scored jointly.track_kwant_stats_per_category – Each category scored independently.The KWANT package provides scoring tools that can be used to calculate the probability of detecting an item, along with other scoring metrics such as ROC curves, specificity, sensitivities, etc. The input to these tools must be in the Kitware kw18 format. Several scripts are provided to convert other formats (such as habcam annotations and Scallop-tk outputs) to kw18 format. The format is very simple so additional converters can be easily created.
These scripts use the KWANT score_tracks tool with the --hadwav scoring
framework to compute track-level and detection-level statistics.
KWANT Output Metrics:
Detection-Pd (Probability of Detection) – Fraction of ground truth detections that were matched by a computed detection: Pd = matched / total_truth. This is the most important single metric for detection performance.
Detection-FA (False Alarms) – Total count of computed detections that did not match any ground truth.
Detection-PFA (Probability of False Alarm) – Fraction of computed detections that are false alarms: PFA = FA / total_computed.
Track-Pd – Probability of detection applied at the track level.
Track-FA – False alarm count at the track level.
Computed-track-PFA – Probability of false alarm for computed tracks.
Frame-NFAR – Normalized false alarm rate per frame (if computed).
Track-frame-precision – Frame-level precision of tracks, measuring how many frames in computed tracks correspond to ground truth.
Avg track continuity – Average length of unbroken computed track segments. Higher values mean fewer tracking gaps.
Avg track purity – Average fraction of each computed track dominated by a single ground truth object (0-1). A purity of 1.0 means each computed track follows exactly one ground truth object without identity confusion.
Avg target continuity – Average length of unbroken ground truth coverage by computed tracks.
Avg target purity – Average fraction of each ground truth object’s coverage dominated by a single computed track.
An example of running scoring tools can be found here. The scoring tool takes two files: the actual detections in the truth file and the computed detections. The computed detections are scored against the truth file to give a set of statistics as shown below. Additional parameters that can be passed to the tool and other options can be found in the KWANT documentation.
HADWAV Scoring Results:
   Detection-Pd: 0.748387
   Detection-FA: 8
   Detection-PFA: 0.0338983
   Frame-NFAR: not computed
   Track-Pd: 0.748387
   Track-FA: 8
   Computed-track-PFA: 0.0338983
   Track-NFAR: not computed
   Avg track (continuity, purity ): 13.693, 1
   Avg target (continuity, purity ): 20.1419, 0.748387
   Track-frame-precision: 0.947826
The tool was originally written to analyze object tracks in full motion video imagery so some of the terminology and calculated metrics may not apply.
One main metric is the probability of detection Pd. This is calculated as follows:
Pd = (num detections match truth) / (num truth)
Detection files can be written in the kw18 format by using the appropriate writer in the pipeline or by running one of these converters. One downside to using the kw18 writer in the pipeline is that the image file name is not captured. All the converters take the same set of command line options. For example:
Usage: habcam_to_kw18.pl [opts] file
  Options:
    --help                     print usage
    --write-file file-name     Write image file/index correspondence to file
    --read-file  file-name     Read image file/index correspondence to file
In order to get the best statistics the number of images processed must be the same as the number of images in the truth set. Computed detections and truth are compared on an image basis so the number of truth entries must be limited to the same number of images as the computed detections. The options to these converters aide in this regard.
Calculated detections are converted first and use the –out-file option to write out the list of files processed. The truth set is processed next with the –in-file option referring to the file created in the previous step. The –cache-only flag should be added to this second conversion to cause images not in the first step to be skipped.
The score_tracks tool is run as follows:
score_tracks --computed-tracks computed_det.kw18 --truth-tracks ground_truth2.kw18
A full list of the options can be coaxed from the tool by using the -? option.
Output is written to the text file specified by -trk-kwant-stats.